One transformation program. Every moving part, connected.
Follow a real SAP S/4HANA program through Ontologic — the work, the people, the risk, the meetings, and the AI that reasons over all of it. This is what “one connected model” actually looks like.
The work
It starts where the program lives — every workstream, milestone, and task in one place.
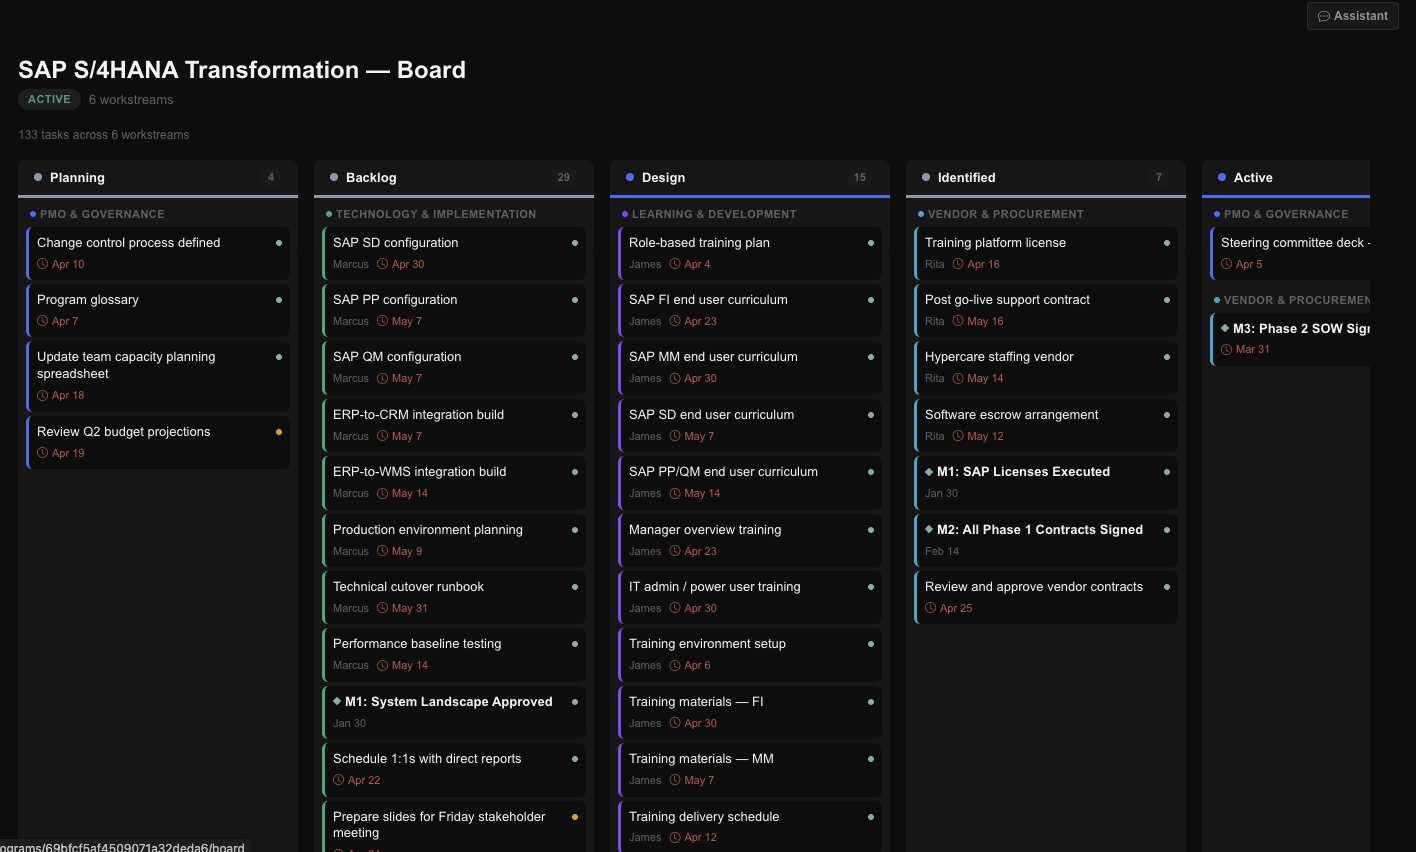
Every tower, every task, one board.
133 tasks across six workstreams — PMO, technology, data, change, L&D, vendor — each with an owner, a date, and a status. Milestones sit inline with the work that has to clear them.
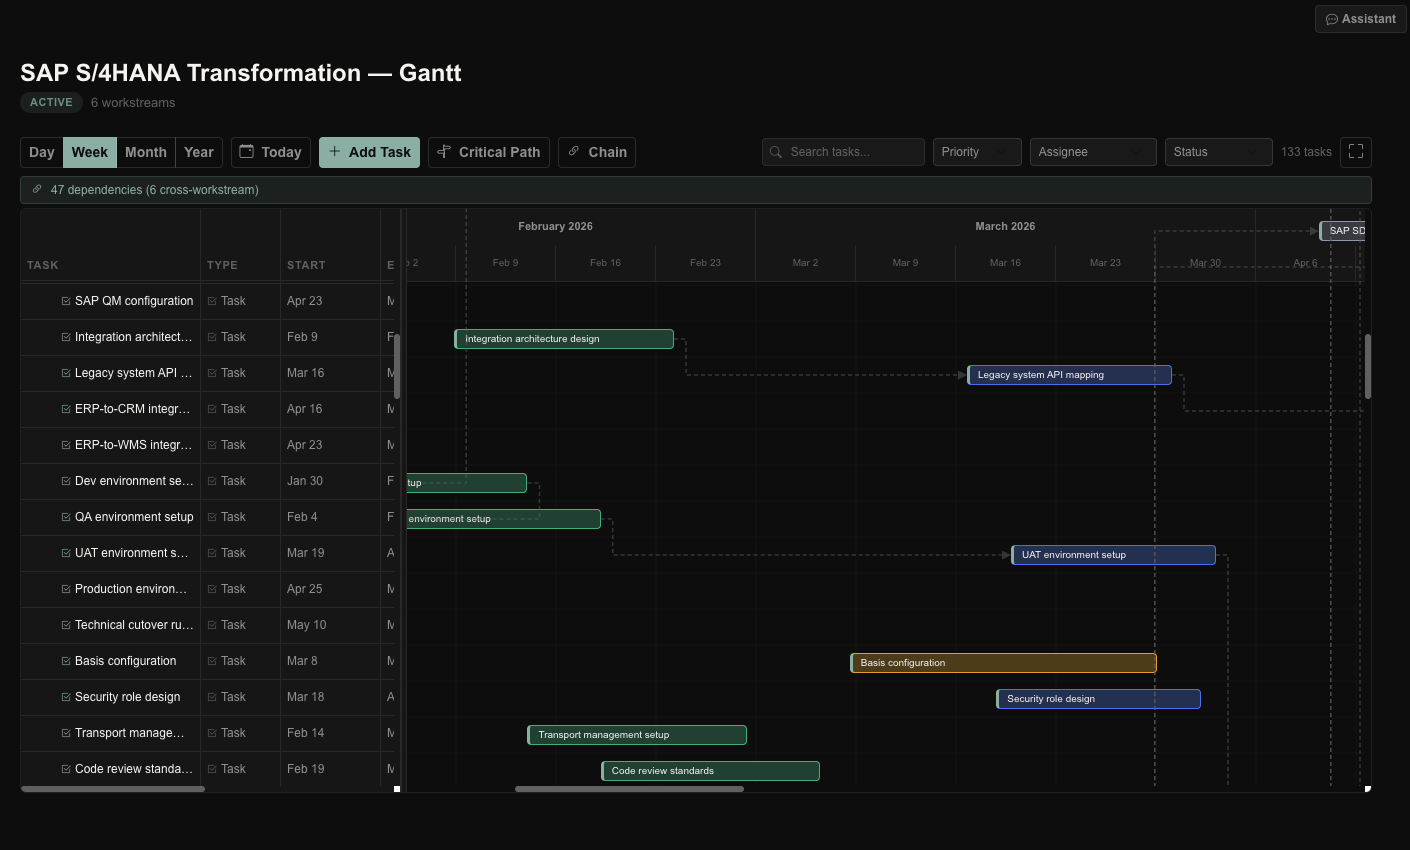
The whole timeline, critical path lit.
Tasks, milestones, and the steering-committee decks for each month — laid against the dependencies between them, so you can see exactly what has to land for the date to hold.
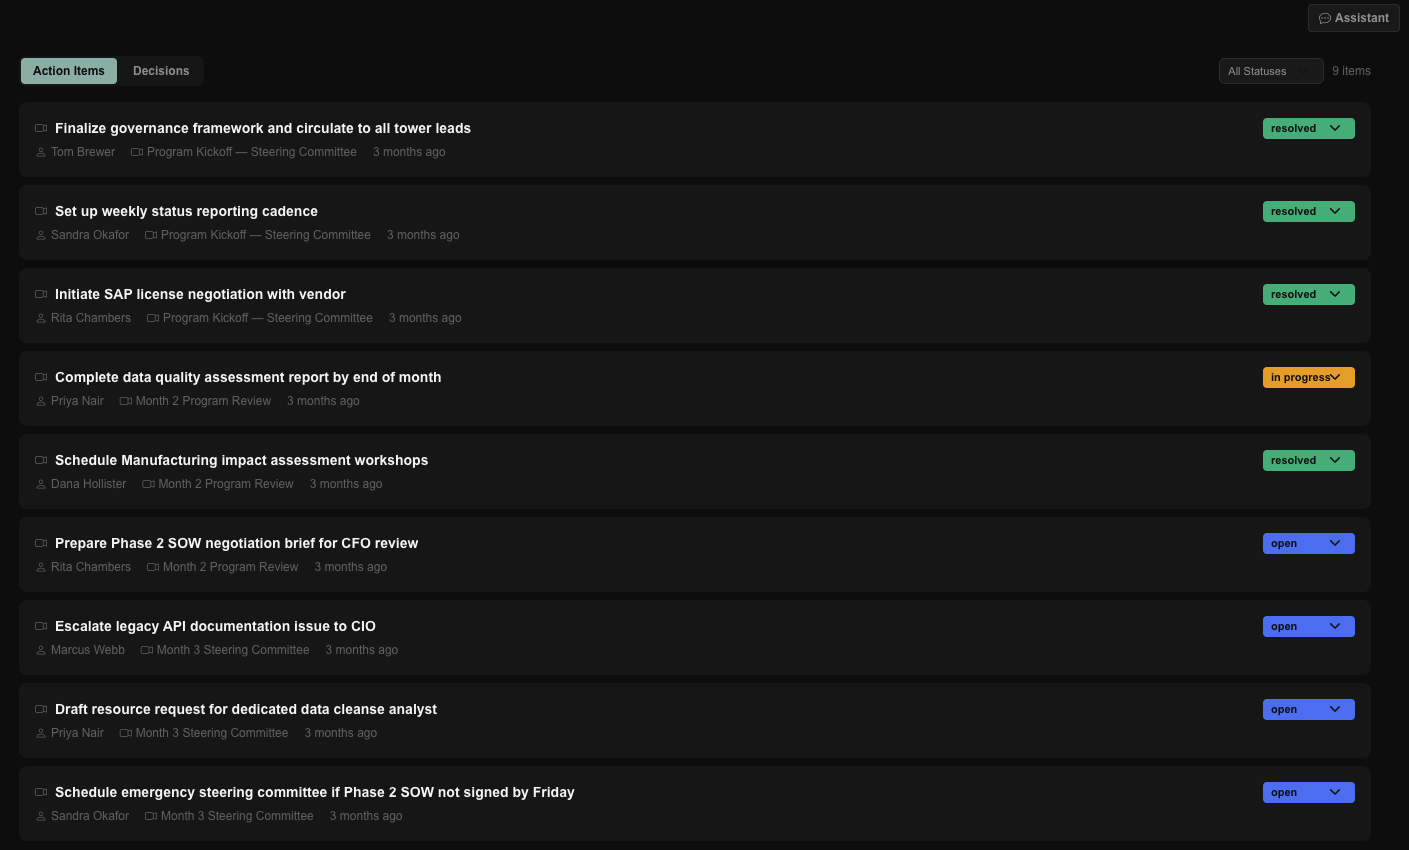
Nothing falls through.
Every action item and decision, tied back to the meeting it came from and the person who owns it — finalize the governance framework, set the reporting cadence, escalate the legacy-API issue to the CIO. Open, in progress, resolved.
The people
Who’s on what, who’s free, and who can actually do the work — across the whole program.
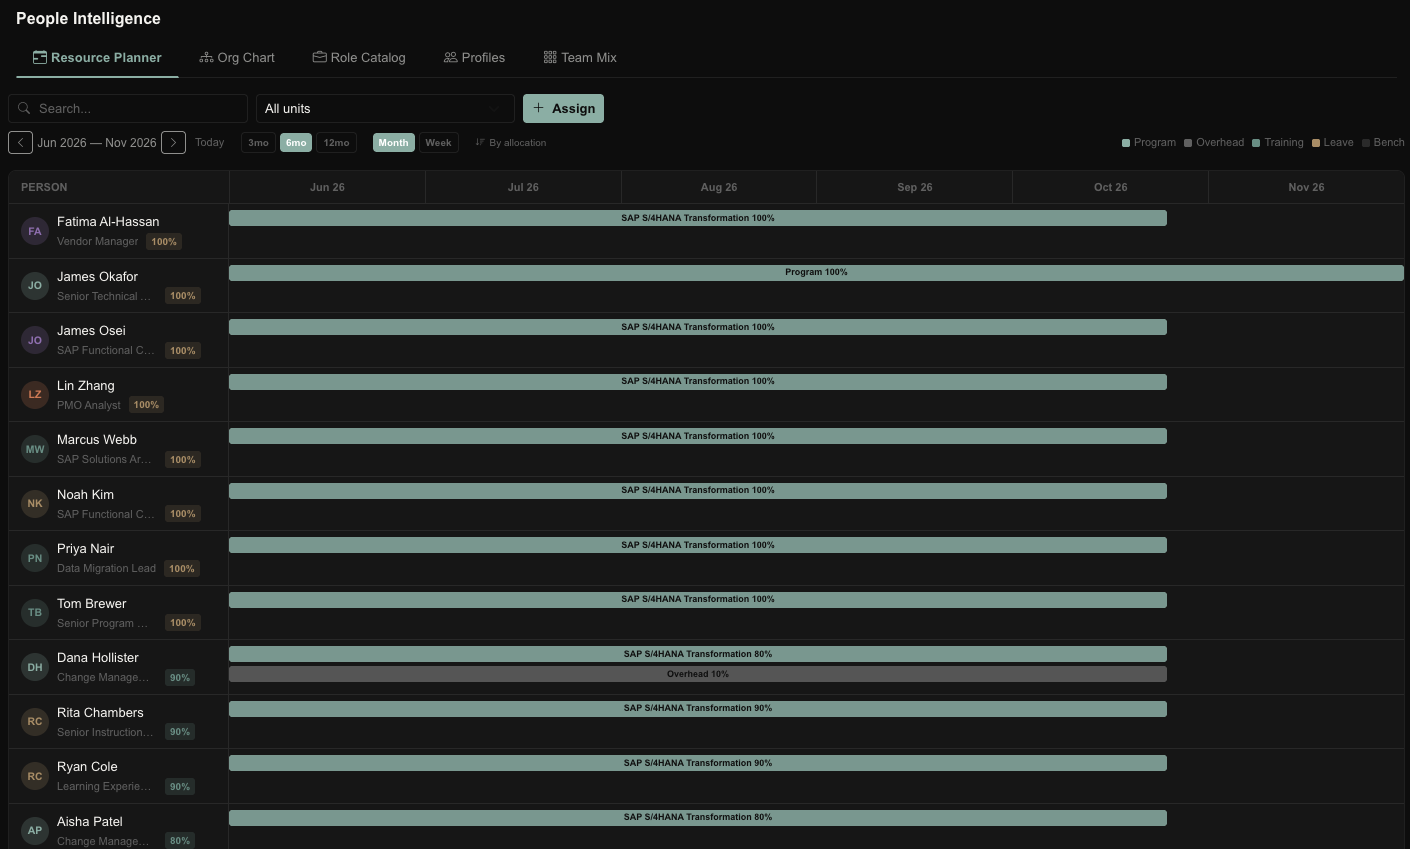
Who’s on what — through go-live.
Allocation across the program, month by month to November, so you can see where the team is already committed before you promise the next thing.
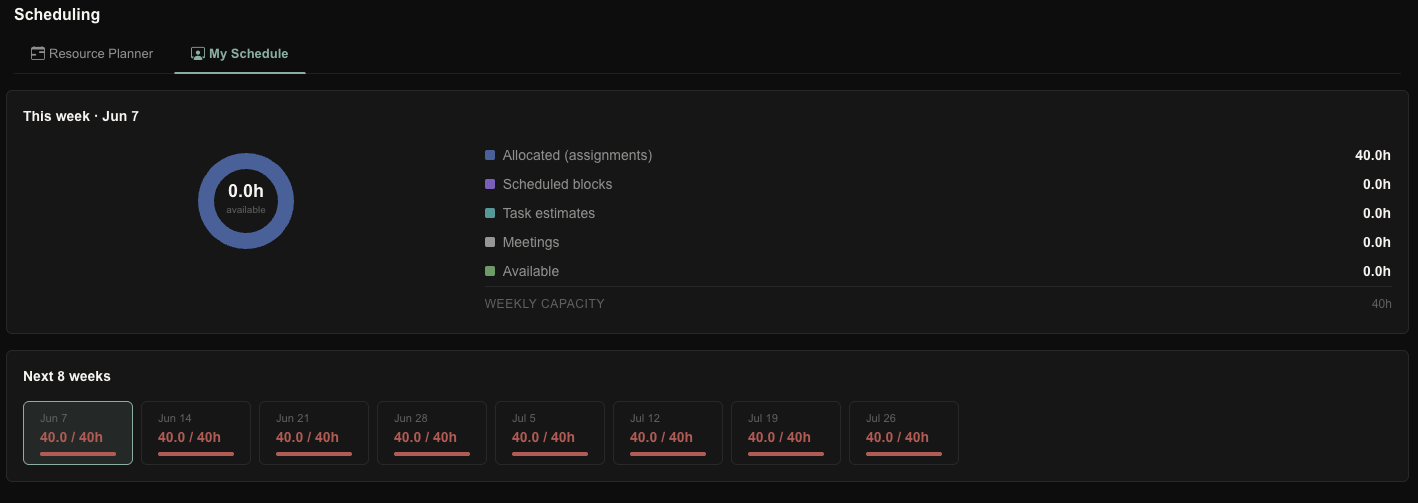
Catch the conflict before it’s a problem.
Eleven allocation conflicts across the program, flagged the moment they form — and every person can see their own week, down to the hour. Not discovered at the next portfolio review.

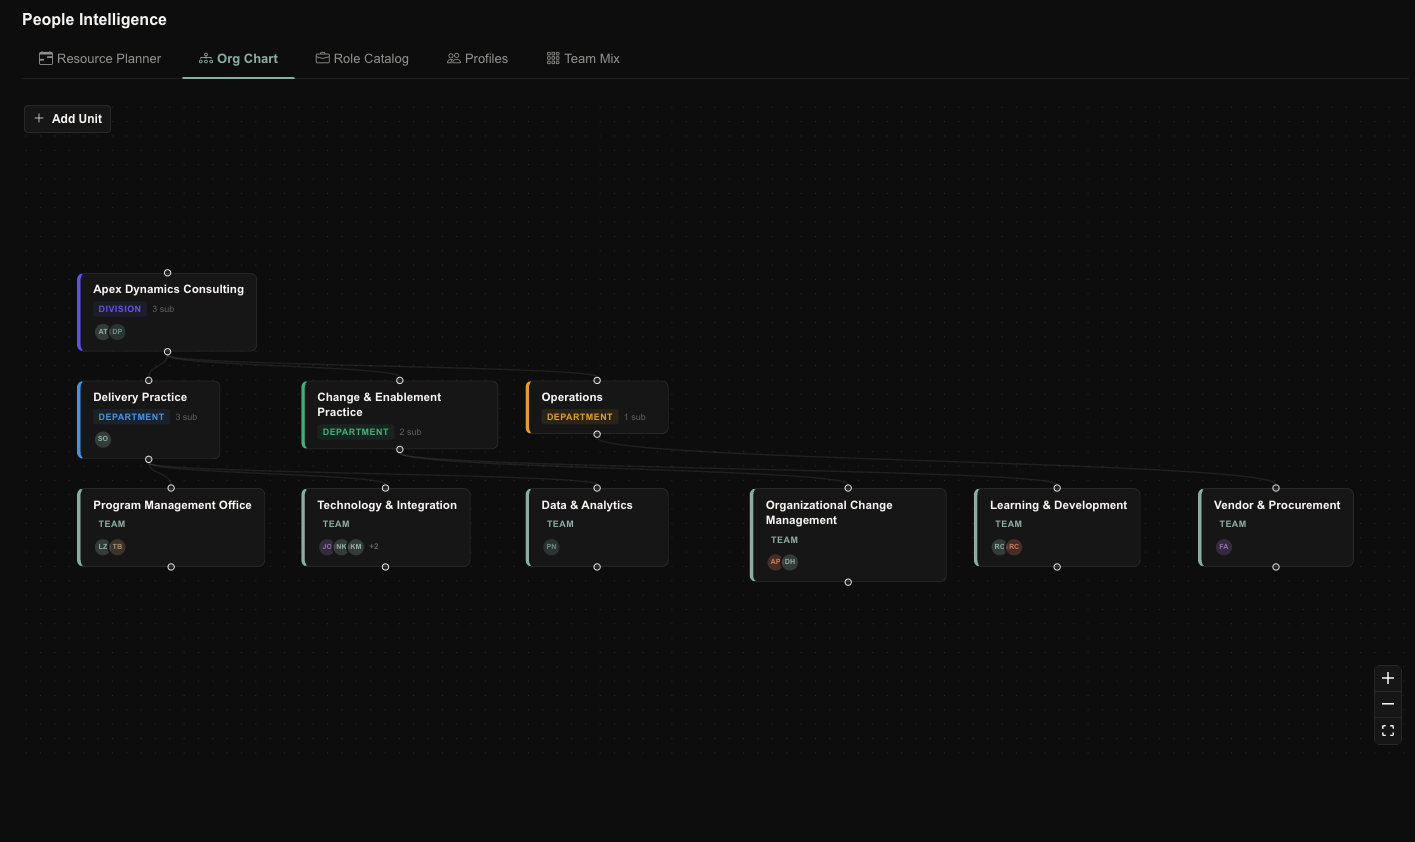
The whole org, mapped.
Divisions, practices, and teams — the actual structure delivering the program, not an org chart in a slide that went stale six months ago.
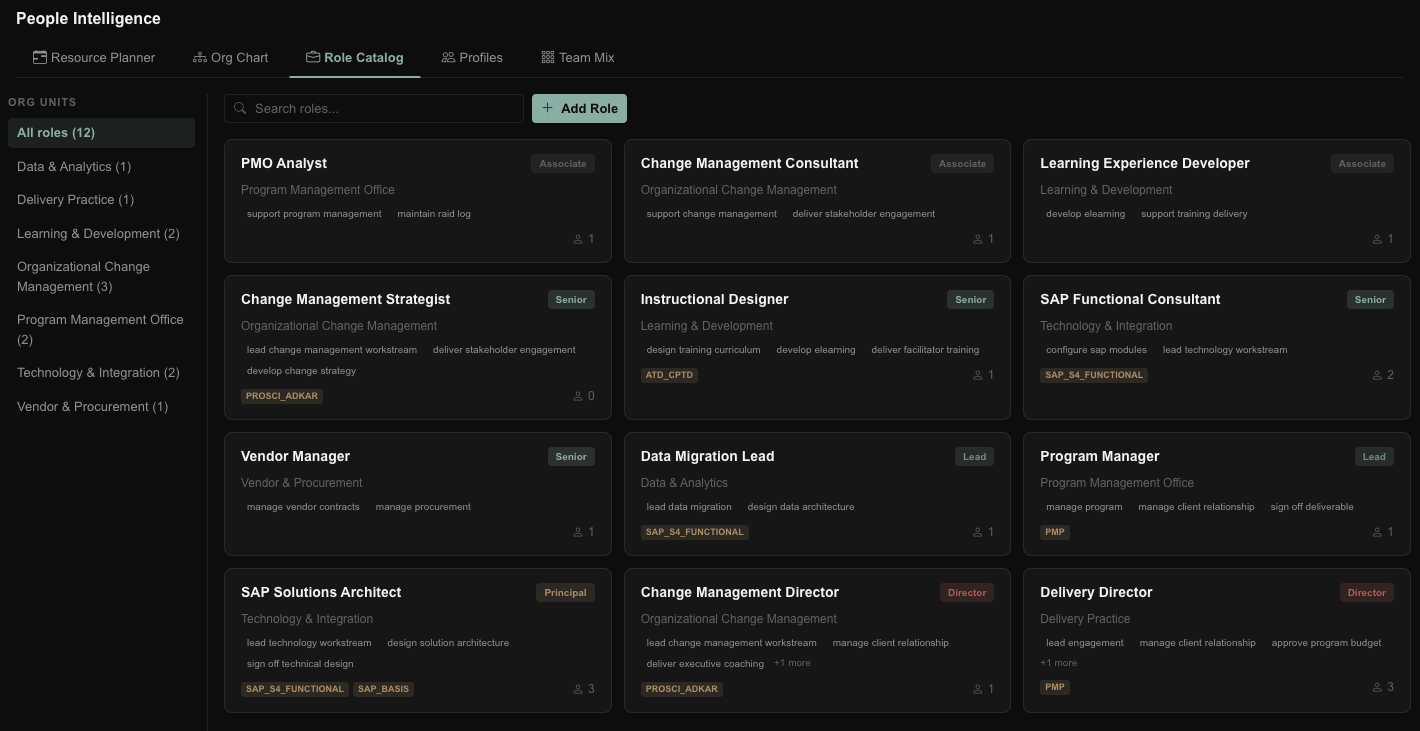
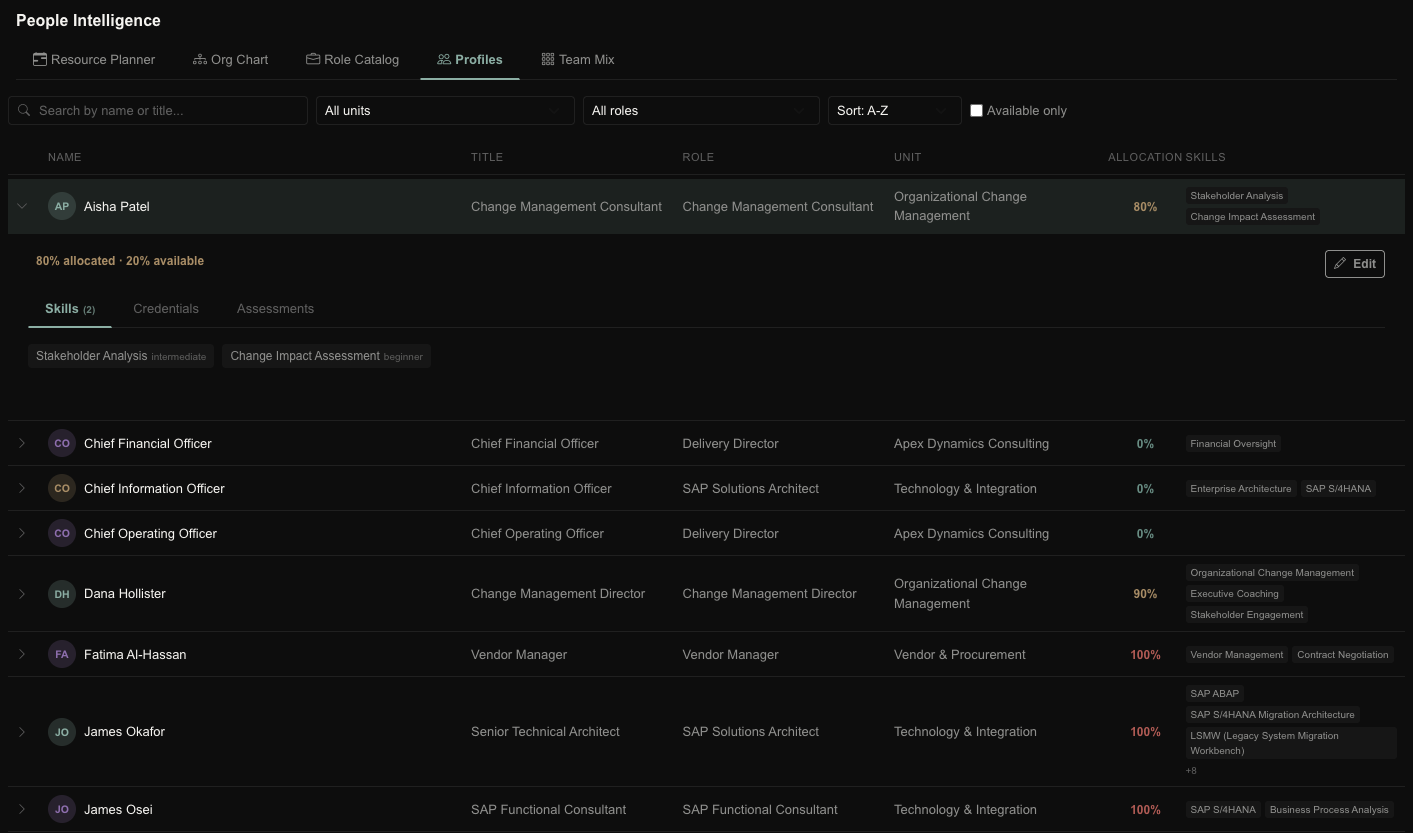
Staff on real capability.
A library of every role and what “good” looks like for it — and every person’s skills, certifications, and allocation. So you put the right people on the right work by what they can actually do.
The risk & governance
Risk surfaced — not buried in a spreadsheet nobody trusts.
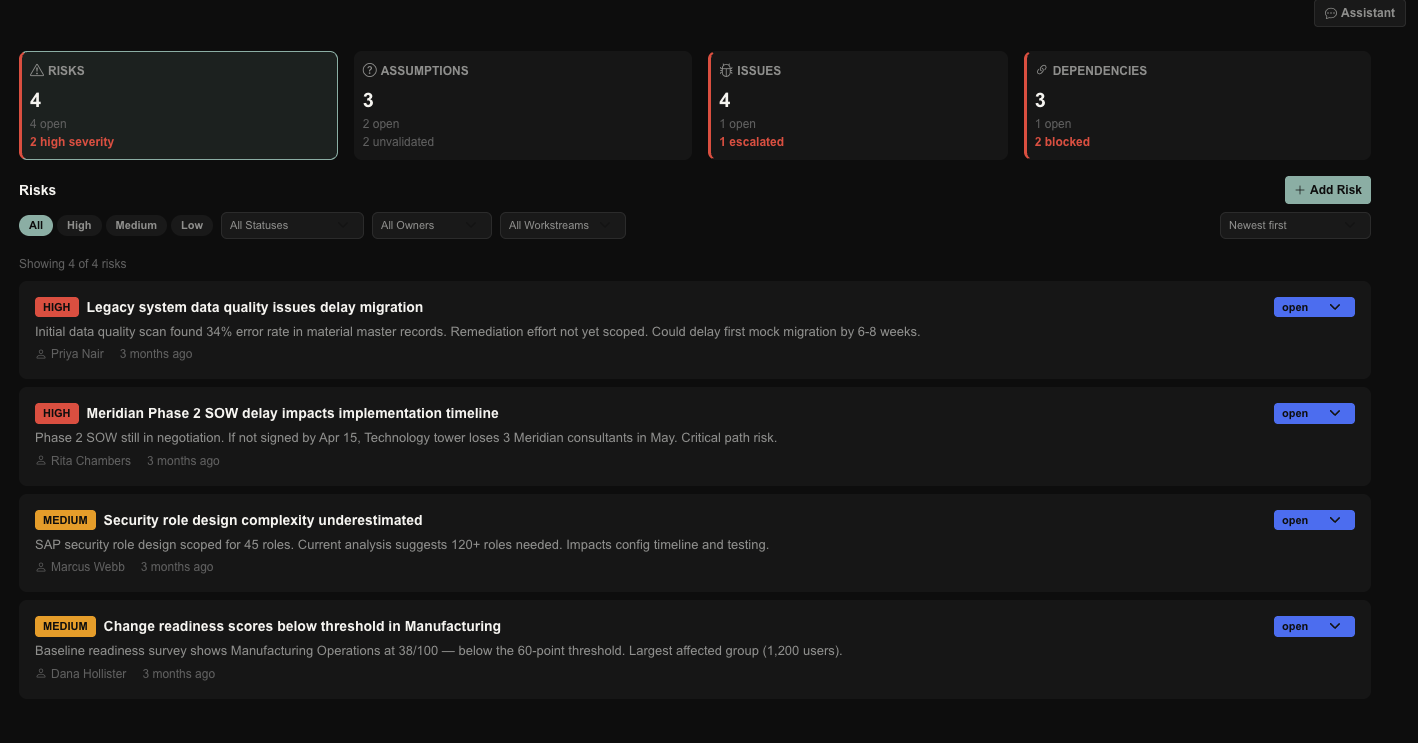
Risk you can actually see.
Risks, assumptions, issues, and dependencies on one board — high-severity items, escalations, and blocked dependencies up top. The data-quality risk that could slip first mock migration by 6–8 weeks is right where you’ll notice it.
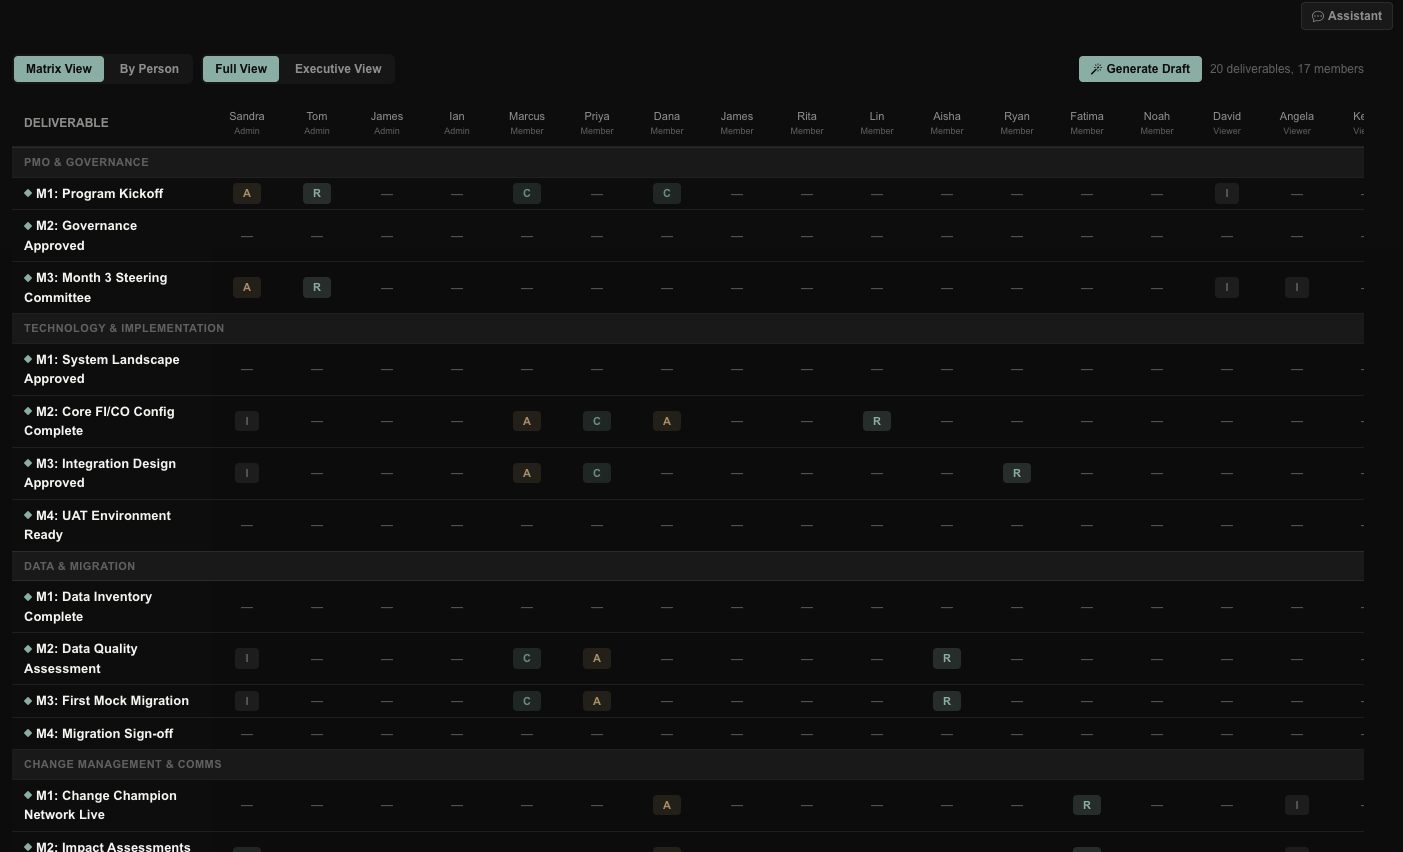
Accountability, explicit.
Who’s responsible, accountable, consulted, and informed on every deliverable and milestone — a live matrix, not a document someone exports once and forgets.
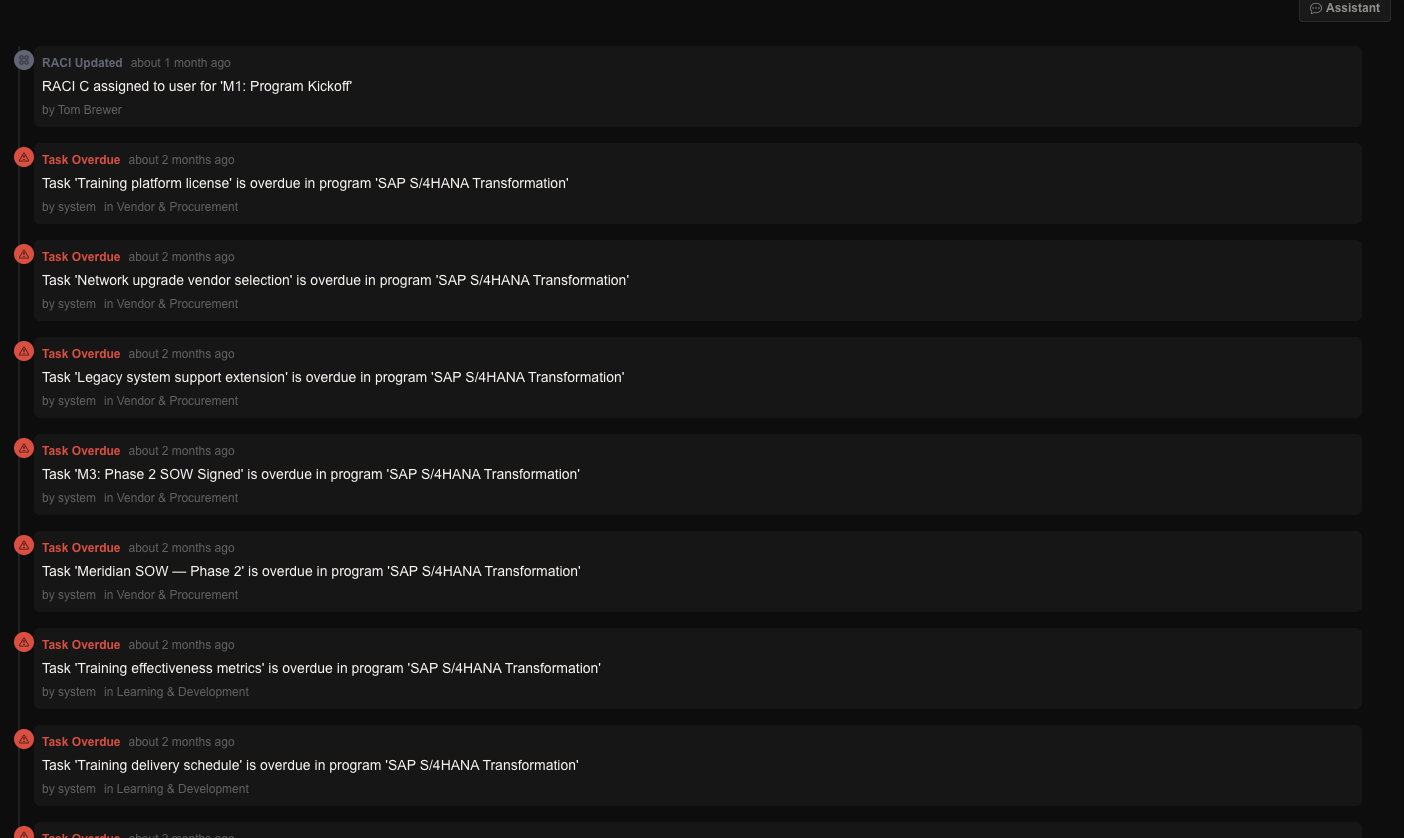
It tells you when something slips.
A live feed across every workstream — RACI changes, overdue tasks, escalations — so a red item finds you, instead of waiting for you to go looking.
The knowledge
Every conversation and document becomes structured, searchable memory.
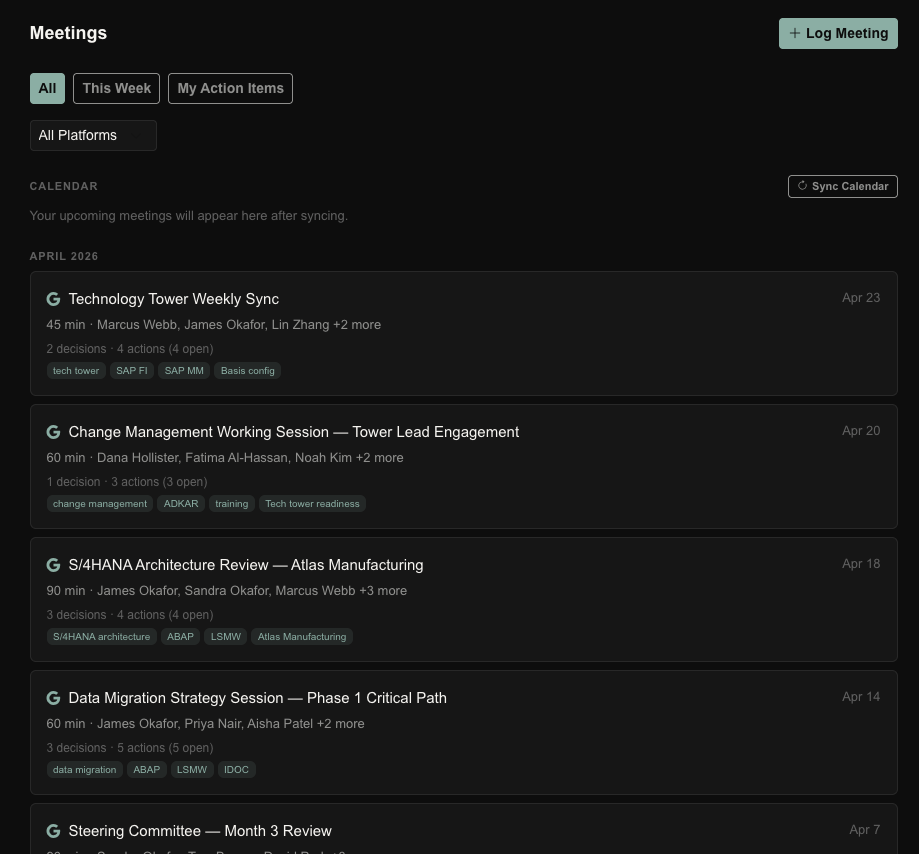
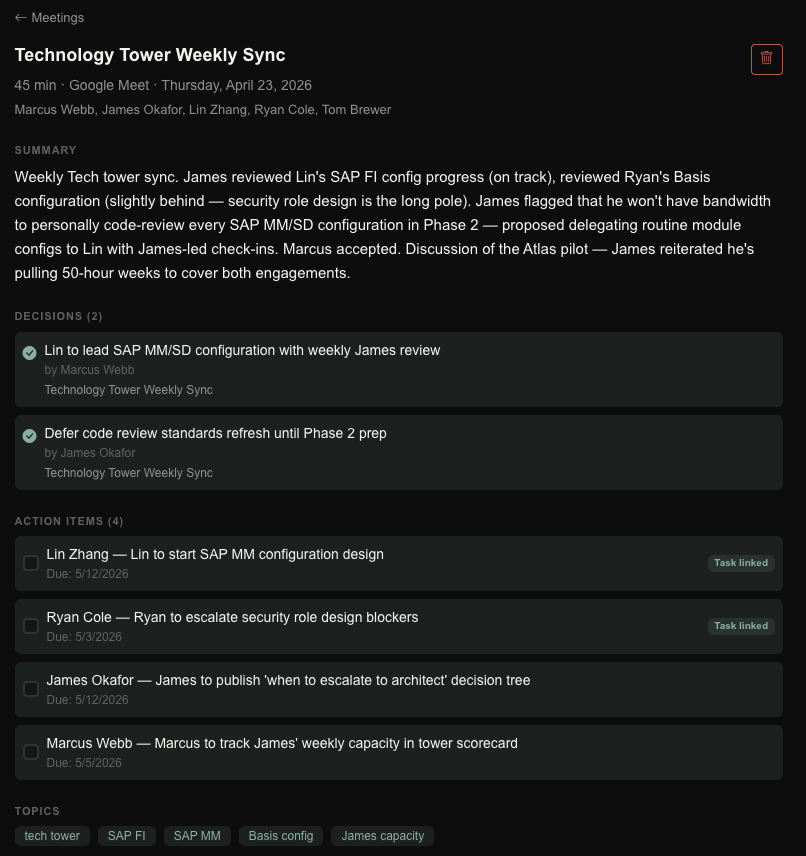
Every meeting becomes structured memory.
The weekly syncs, the architecture reviews, the steering committees — each captured with its summary, decisions, action items, and topics, and linked straight to the tasks they create.
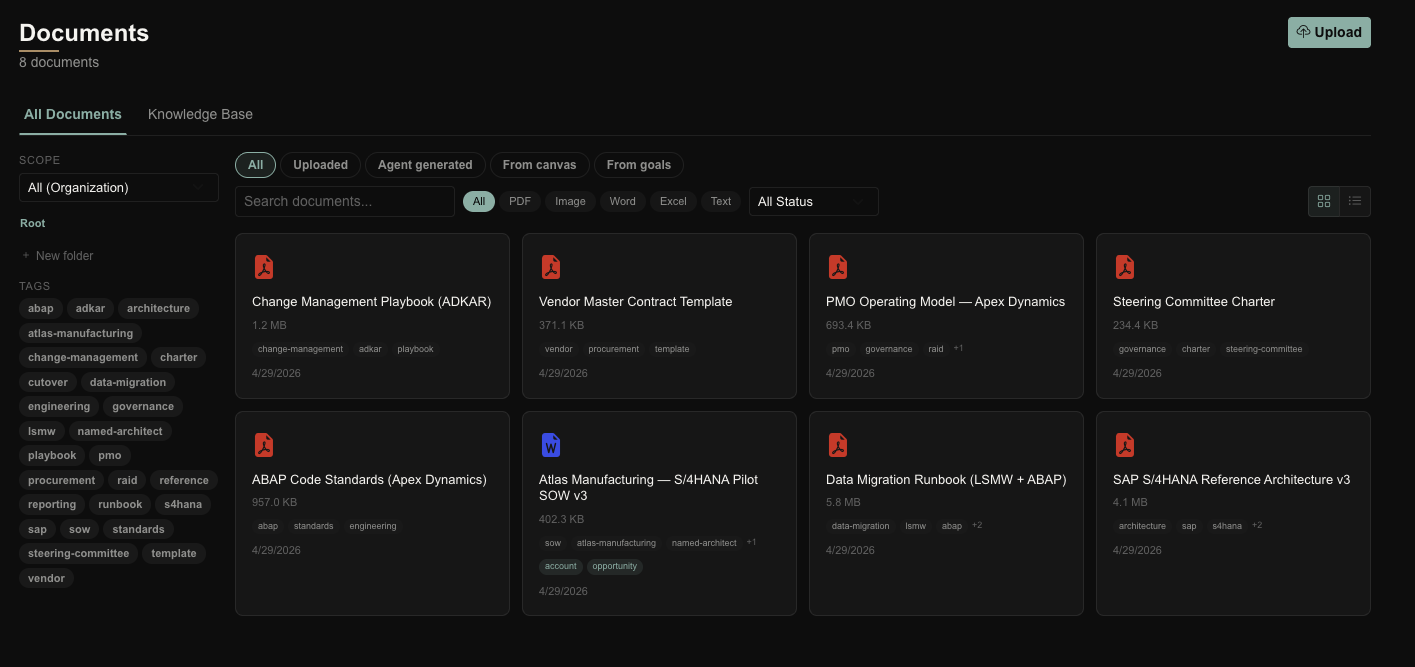
The institutional memory, in one place.
Playbooks, charters, runbooks, contracts — the change-management playbook, the PMO operating model, the data-migration runbook — tagged and connected to the work they govern.
The model underneath
None of this is hardcoded. It’s your firm’s model — and it’s all one graph.
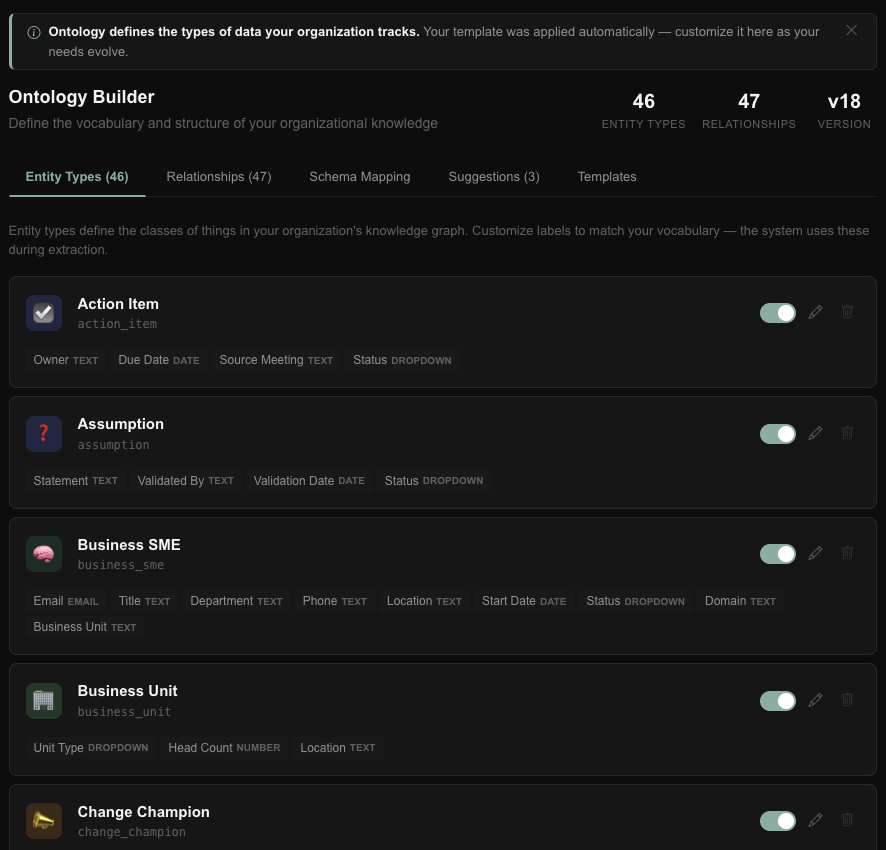
Your vocabulary, not ours.
46 entity types and 47 relationships define how this firm thinks — action items, assumptions, business units, change champions, each with its own fields. Shape it to your world; the AI reads from the same model.
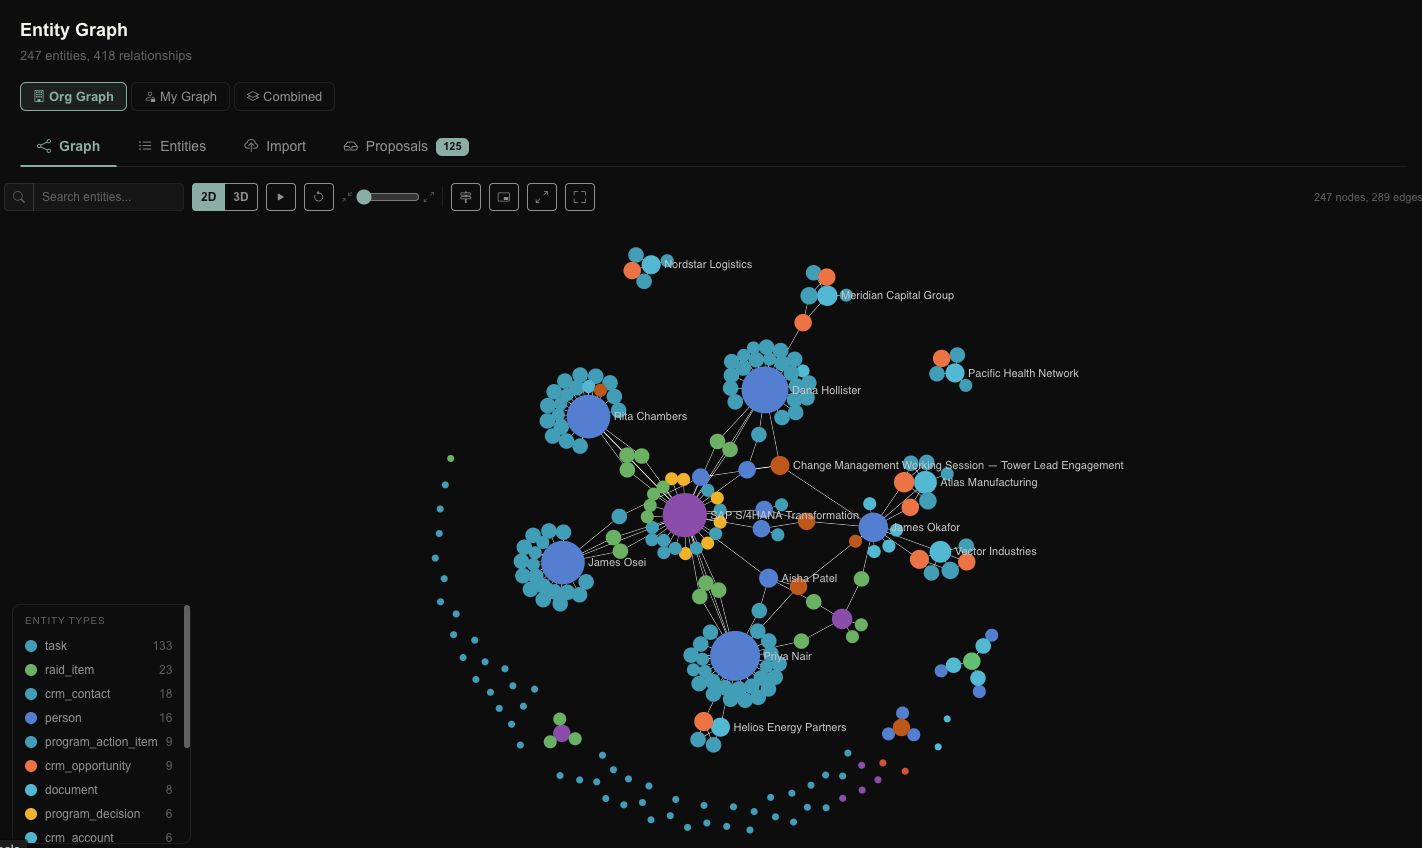
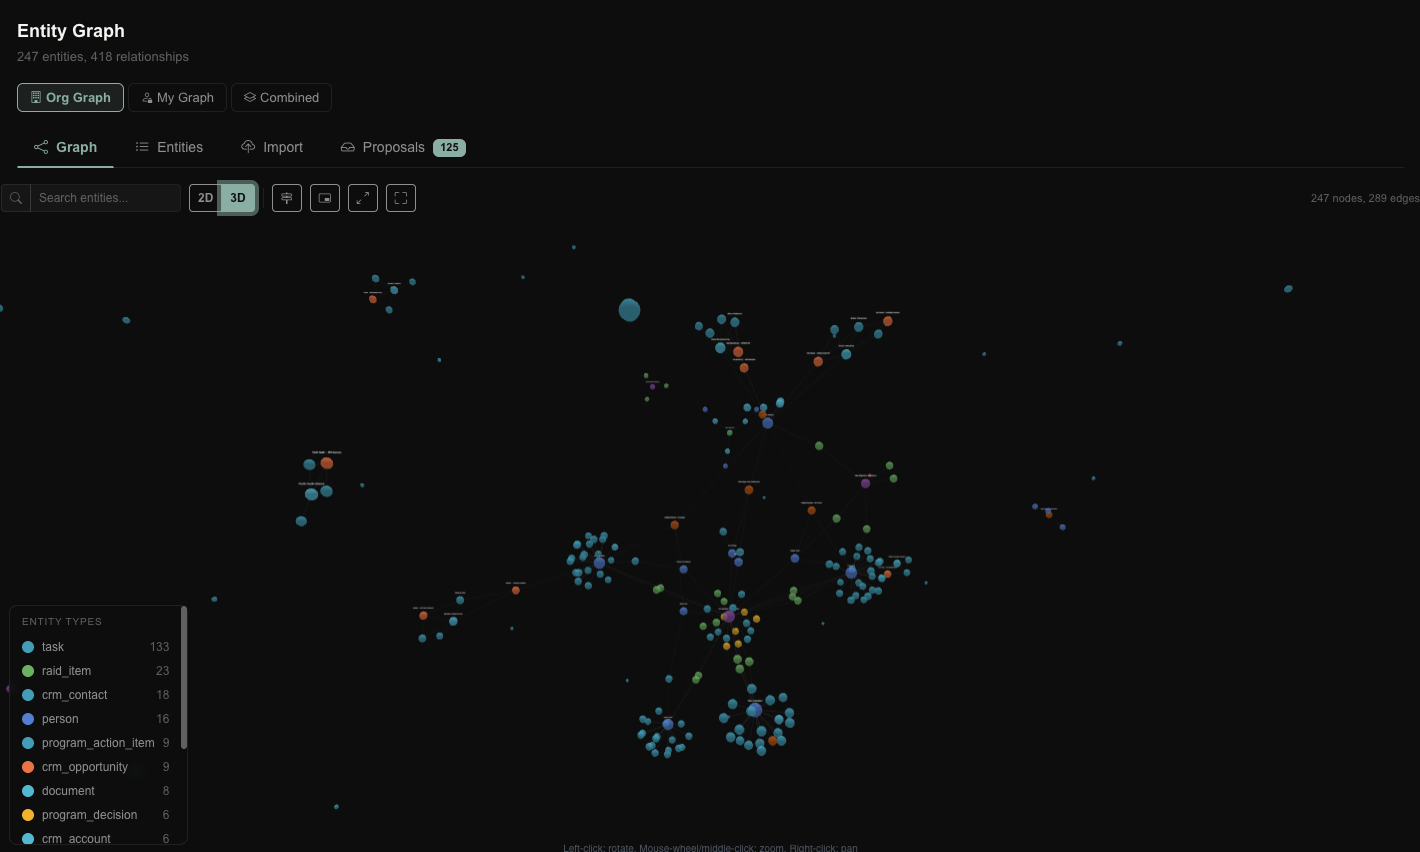
And it’s all one graph.
247 entities and 418 relationships — programs, people, risks, clients, documents — connected. The SAP transformation, Atlas Manufacturing, Meridian, the architects, every task, all in one model you can see, query, and act on.
The intelligence
Because everything shares one model, the AI can reason over the whole thing — and act.
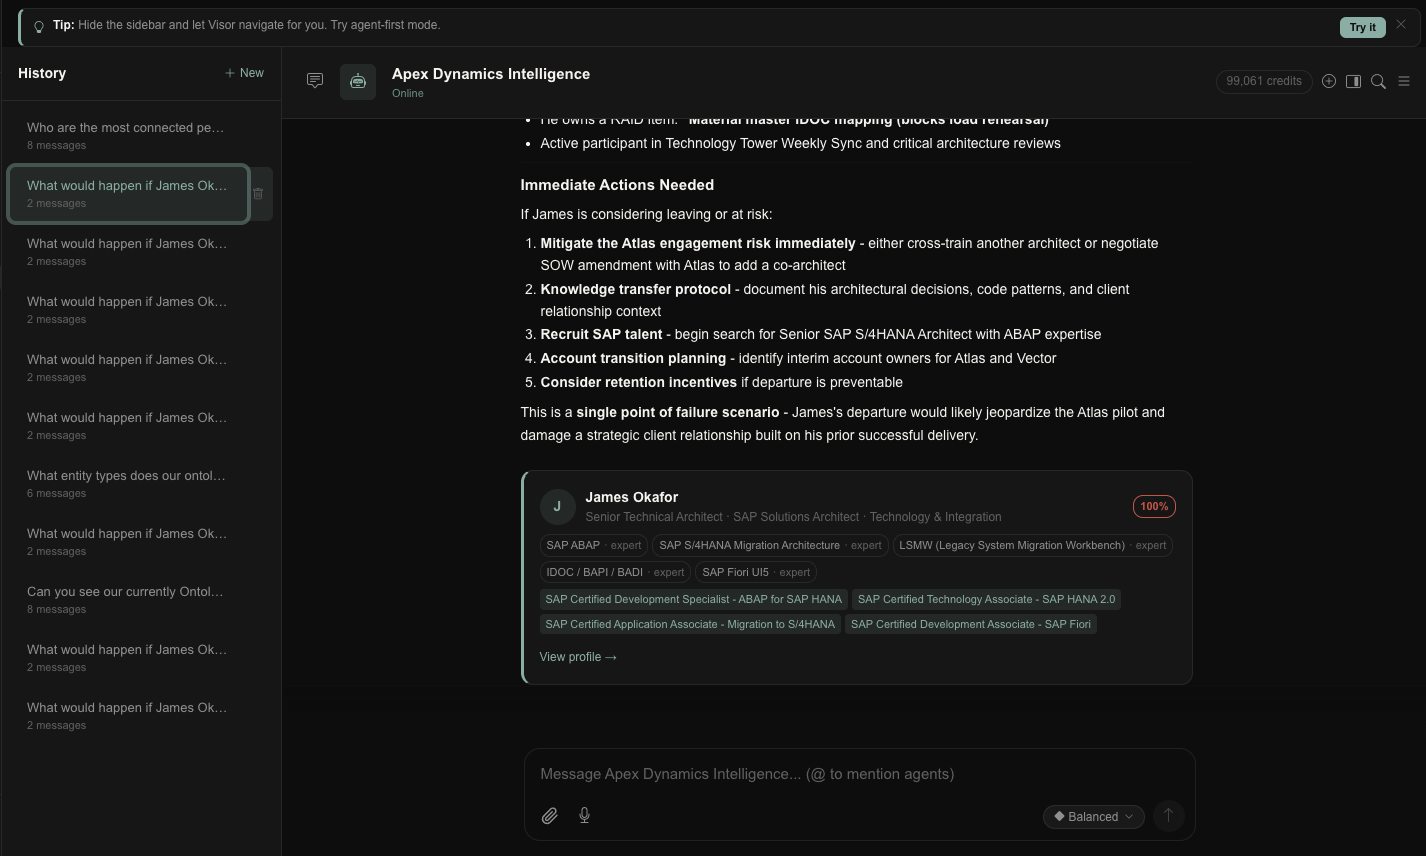
It reasons over the whole program.
“What would happen if James Okafor left?” It traces his engagements, skills, certifications, and the RAID items he owns, and tells you it’s a single point of failure on the Atlas pilot — with the mitigations to run now. That’s an answer no spreadsheet can give.
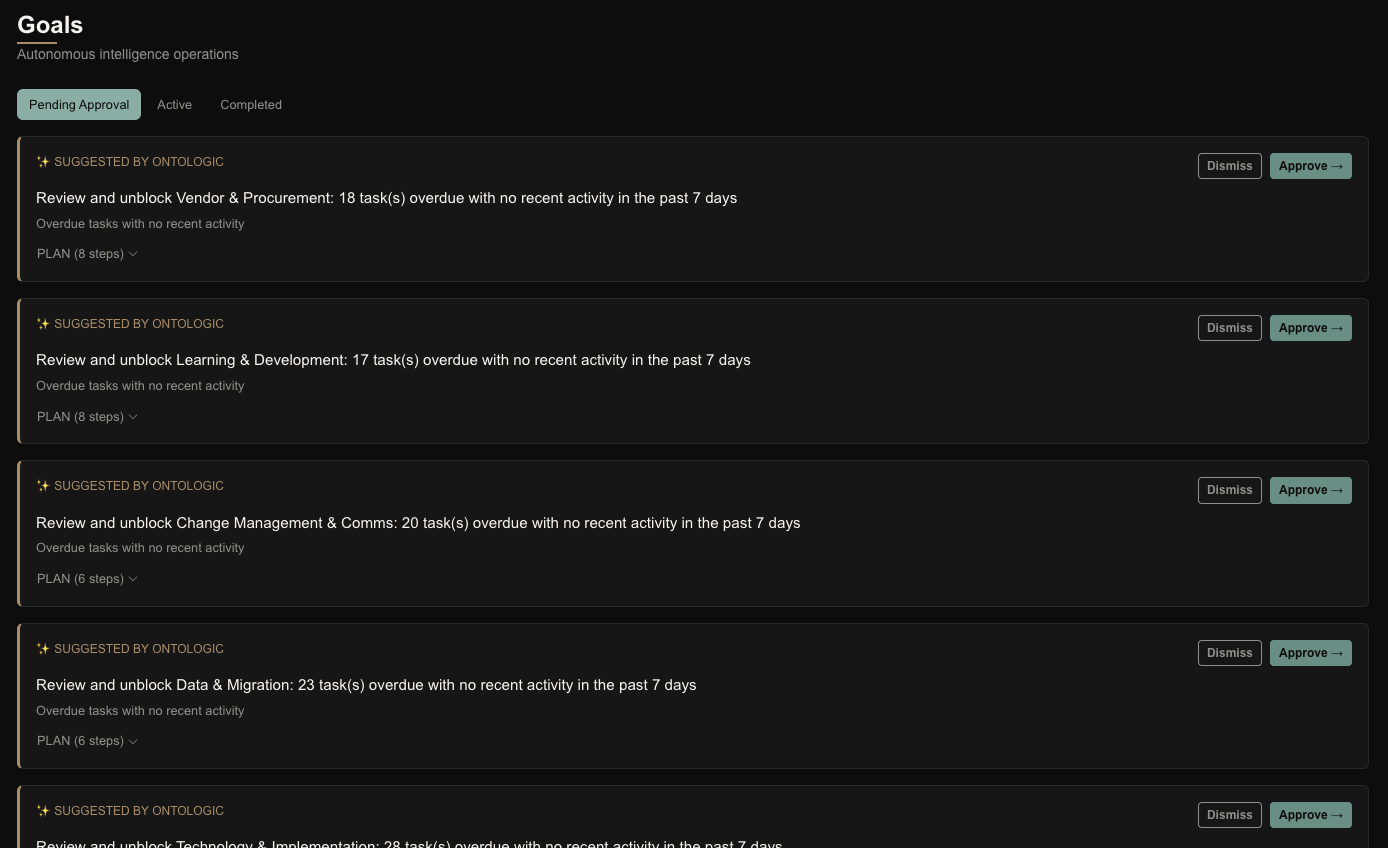
And it doesn’t just answer. It acts.
Ontologic proposes the work itself — “review and unblock Vendor & Procurement: 18 tasks overdue,” with an 8-step plan ready to run. You approve; it executes. Autonomous operations, on your governance.
It all runs on one model — and it’s yours to extend.
Everything you just scrolled through lives on a single connected model. When you need something off-the-shelf software doesn’t have — a custom intake, a margin view, a delivery board built exactly your way — Ontologic’s App Builder spins up apps on your own graph, wired into everything you’ve seen, with AI building them alongside you. The platform goes as deep as your program does.
Each question spans modules a single tool keeps apart. One graph is what makes the answer — and the action — possible.
This is one program. Imagine your whole portfolio.
Everything you just scrolled through is one connected model — and the AI runs on it. If you’re leading transformational work on spreadsheets and steering decks, let’s show you what it looks like for your firm.